

Quick answer: factory solar sizing in Nigeria
Factory solar sizing in Nigeria is a two-number exercise: array kW comes from daytime kWh divided by your city’s yield per kWp, and battery kWh comes from the non-solar-hours energy you need to carry divided by usable depth of discharge. Everything else — inverter rating, AC/DC ratio, module count — is derived from those two numbers.
On this page
- Why roof area is the wrong first question
- Step 1 — capture the load profile
- Step 2 — split base load from peak
- Step 3 — size the array in kW
- Step 4 — size storage in kWh
- Step 5 — inverter headroom
- Worked example: a 14-hour Lagos factory
- What it costs in 2026
- Five mistakes
Why Roof Area Is the Wrong First Question
Most quotes in Nigeria open with “how much roof do you have?” and close with an array sized to fill it. That inverts the logic: roof area is a constraint on factory solar sizing, not a driver of it. The correct order is load first, generation second, storage third, and only at the end does the roof tell you whether the design fits.
Getting it backwards costs money in two places. Oversize the array and the surplus is wasted — most Nigerian factories have no export agreement, so generation above your own daytime load is simply discarded. Undersize the battery and the generator still starts every evening, which is exactly where the diesel bill lives. Factory solar sizing that starts from the roof therefore costs more and delivers less: either error stretches payback from under 18 months to four years or more.
There is a third reason specific to Nigeria. With 8–12 outages a day reported on many feeders, the curve you are designing against is not your grid consumption — it is your generator runtime. That is the data you have to capture, and it is also why the business case rests on diesel displacement rather than bill savings. At around $0.049/kWh (GlobalPetrolPrices, December 2025) grid power is cheap on paper; the diesel you burn to replace it is not. See the diesel-versus-solar math for the full comparison.
Step 1 — Capture 7–14 Days of Real Load Data
Factory solar sizing needs a curve, not a monthly total. Record at 15-minute or hourly resolution for at least seven days; fourteen is better because it captures a weekend and at least one production changeover. Factory solar sizing is only as good as this dataset: if you have no data logger, a week’s clamp-meter hire costs far less than the error it prevents.
| Data point | Resolution | What it feeds |
|---|---|---|
| Grid import (kWh) | 15 min | Daytime base load |
| Generator runtime and fuel (L) | per shift | True cost of the hours being replaced |
| Peak simultaneous demand (kW) | 15 min max | Inverter and genset rating |
| Shift pattern | per day | Whether daytime load justifies PV at all |
| Motor starts and power factor | per event | Surge headroom |
Step 2 — Split Day-Shift Base Load From Evening Peak
Plot the curve and cut it into three bands: solar hours (roughly 08:00–17:00), an evening peak (17:00–22:00) and night (22:00–06:00). The first band is what the array can serve directly. The other two are what storage has to carry. Once the curve is plotted, factory solar sizing becomes arithmetic rather than guesswork.
The number that decides the whole design is the area under the curve outside solar hours. That single figure is what pushes factory solar sizing towards a 215kWh container or a 1MWh one, and it is why two factories with identical monthly consumption can need completely different systems: a three-shift plant with a flat curve is a far better solar customer than a single-shift plant that does all its work after dark.
Step 3 — Size the Array in kW From Daytime kWh
Step three of factory solar sizing turns daytime consumption into an array: kWp = daytime kWh ÷ yield per kWp per day. Nothing else belongs in this calculation — not roof area, not module count, not the size of the generator you are replacing.
Nigerian yields vary more than most buyers expect. Long-term average output for a fixed, optimally tilted array runs from 3.43 kWh/kWp/day in Port Harcourt to 4.71 in Jos, with Lagos at 3.63 — Global Solar Atlas 2.0, built on Solargis and World Bank data. Check your own site on the Global Solar Atlas before committing; sizing on a round “five peak sun hours” overstates Lagos output by roughly a third.
Worked: a factory consuming 360kWh between 08:00 and 17:00 in Lagos needs 360 ÷ 3.63 = 99kWp. Round to the nearest standard block — 100kW — then trim slightly if you have no use for surplus, or add a block if a second shift is planned.
Step 4 — Size Storage in kWh From Autonomy Hours
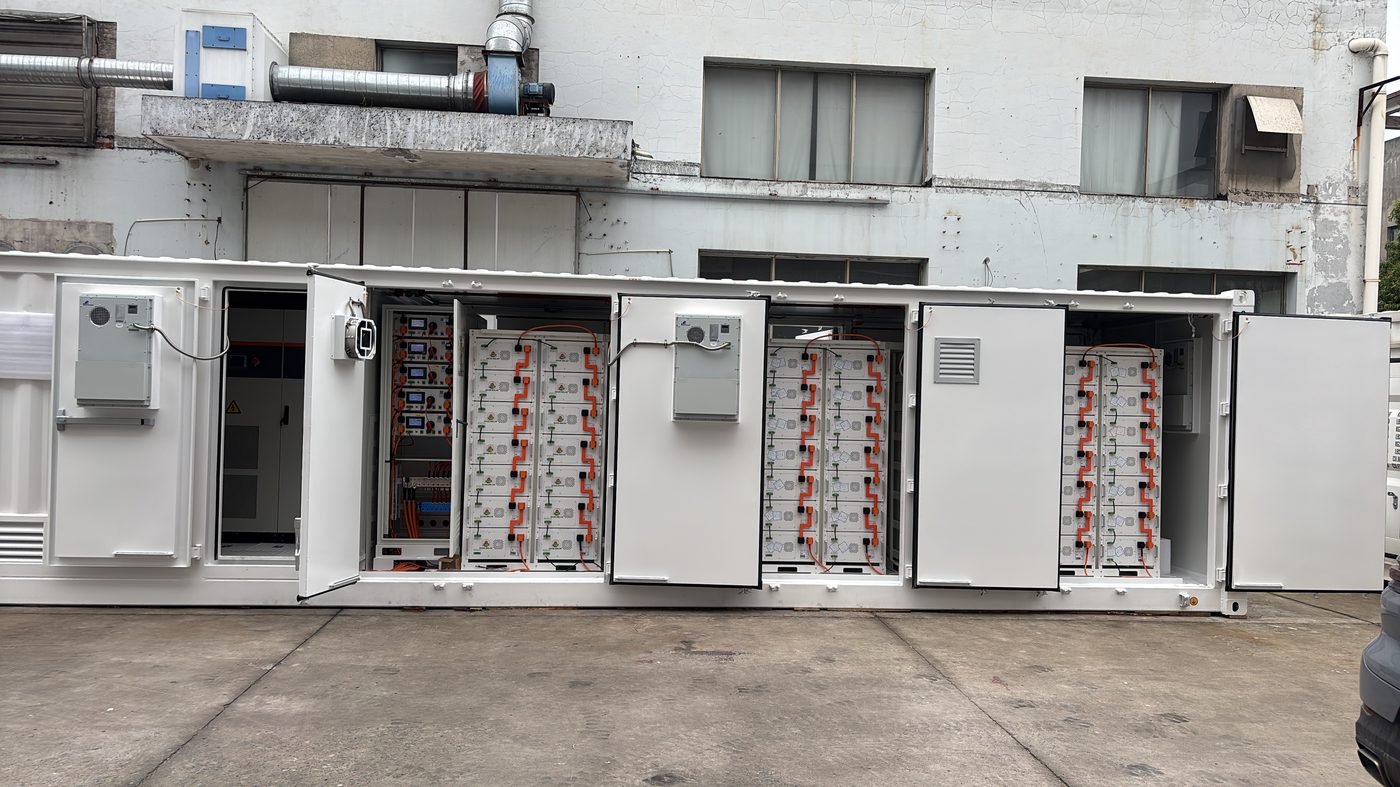
Step four of factory solar sizing converts that energy into a battery. Battery kWh nominal = non-solar-hours kWh ÷ usable depth of discharge. LFP at 80 percent DoD returns 0.80kWh per kWh installed, so 170kWh of evening and night load needs 170 ÷ 0.80 = 213kWh nominal — the 215kWh block in our standard range.
| Autonomy needed | Load carried (50kW evening load) | Nominal kWh at 80% DoD |
|---|---|---|
| 2 hours | 100kWh | 125kWh |
| 4 hours | 200kWh | 250kWh |
| 6 hours | 300kWh | 375kWh |
| 8 hours | 400kWh | 500kWh |
| 10 hours | 500kWh | 625kWh |
Two adjustments before you freeze the number. First, reserve: most factories keep 15–20 percent held back for an outage that outlasts the model, which pushes nominal capacity up by roughly a quarter. Second, temperature: a battery room without ventilation in Nigerian heat loses usable capacity and cycle life, so specify the cooling with the capacity, not after it.
Step 5 — Inverter Headroom and the AC/DC Ratio
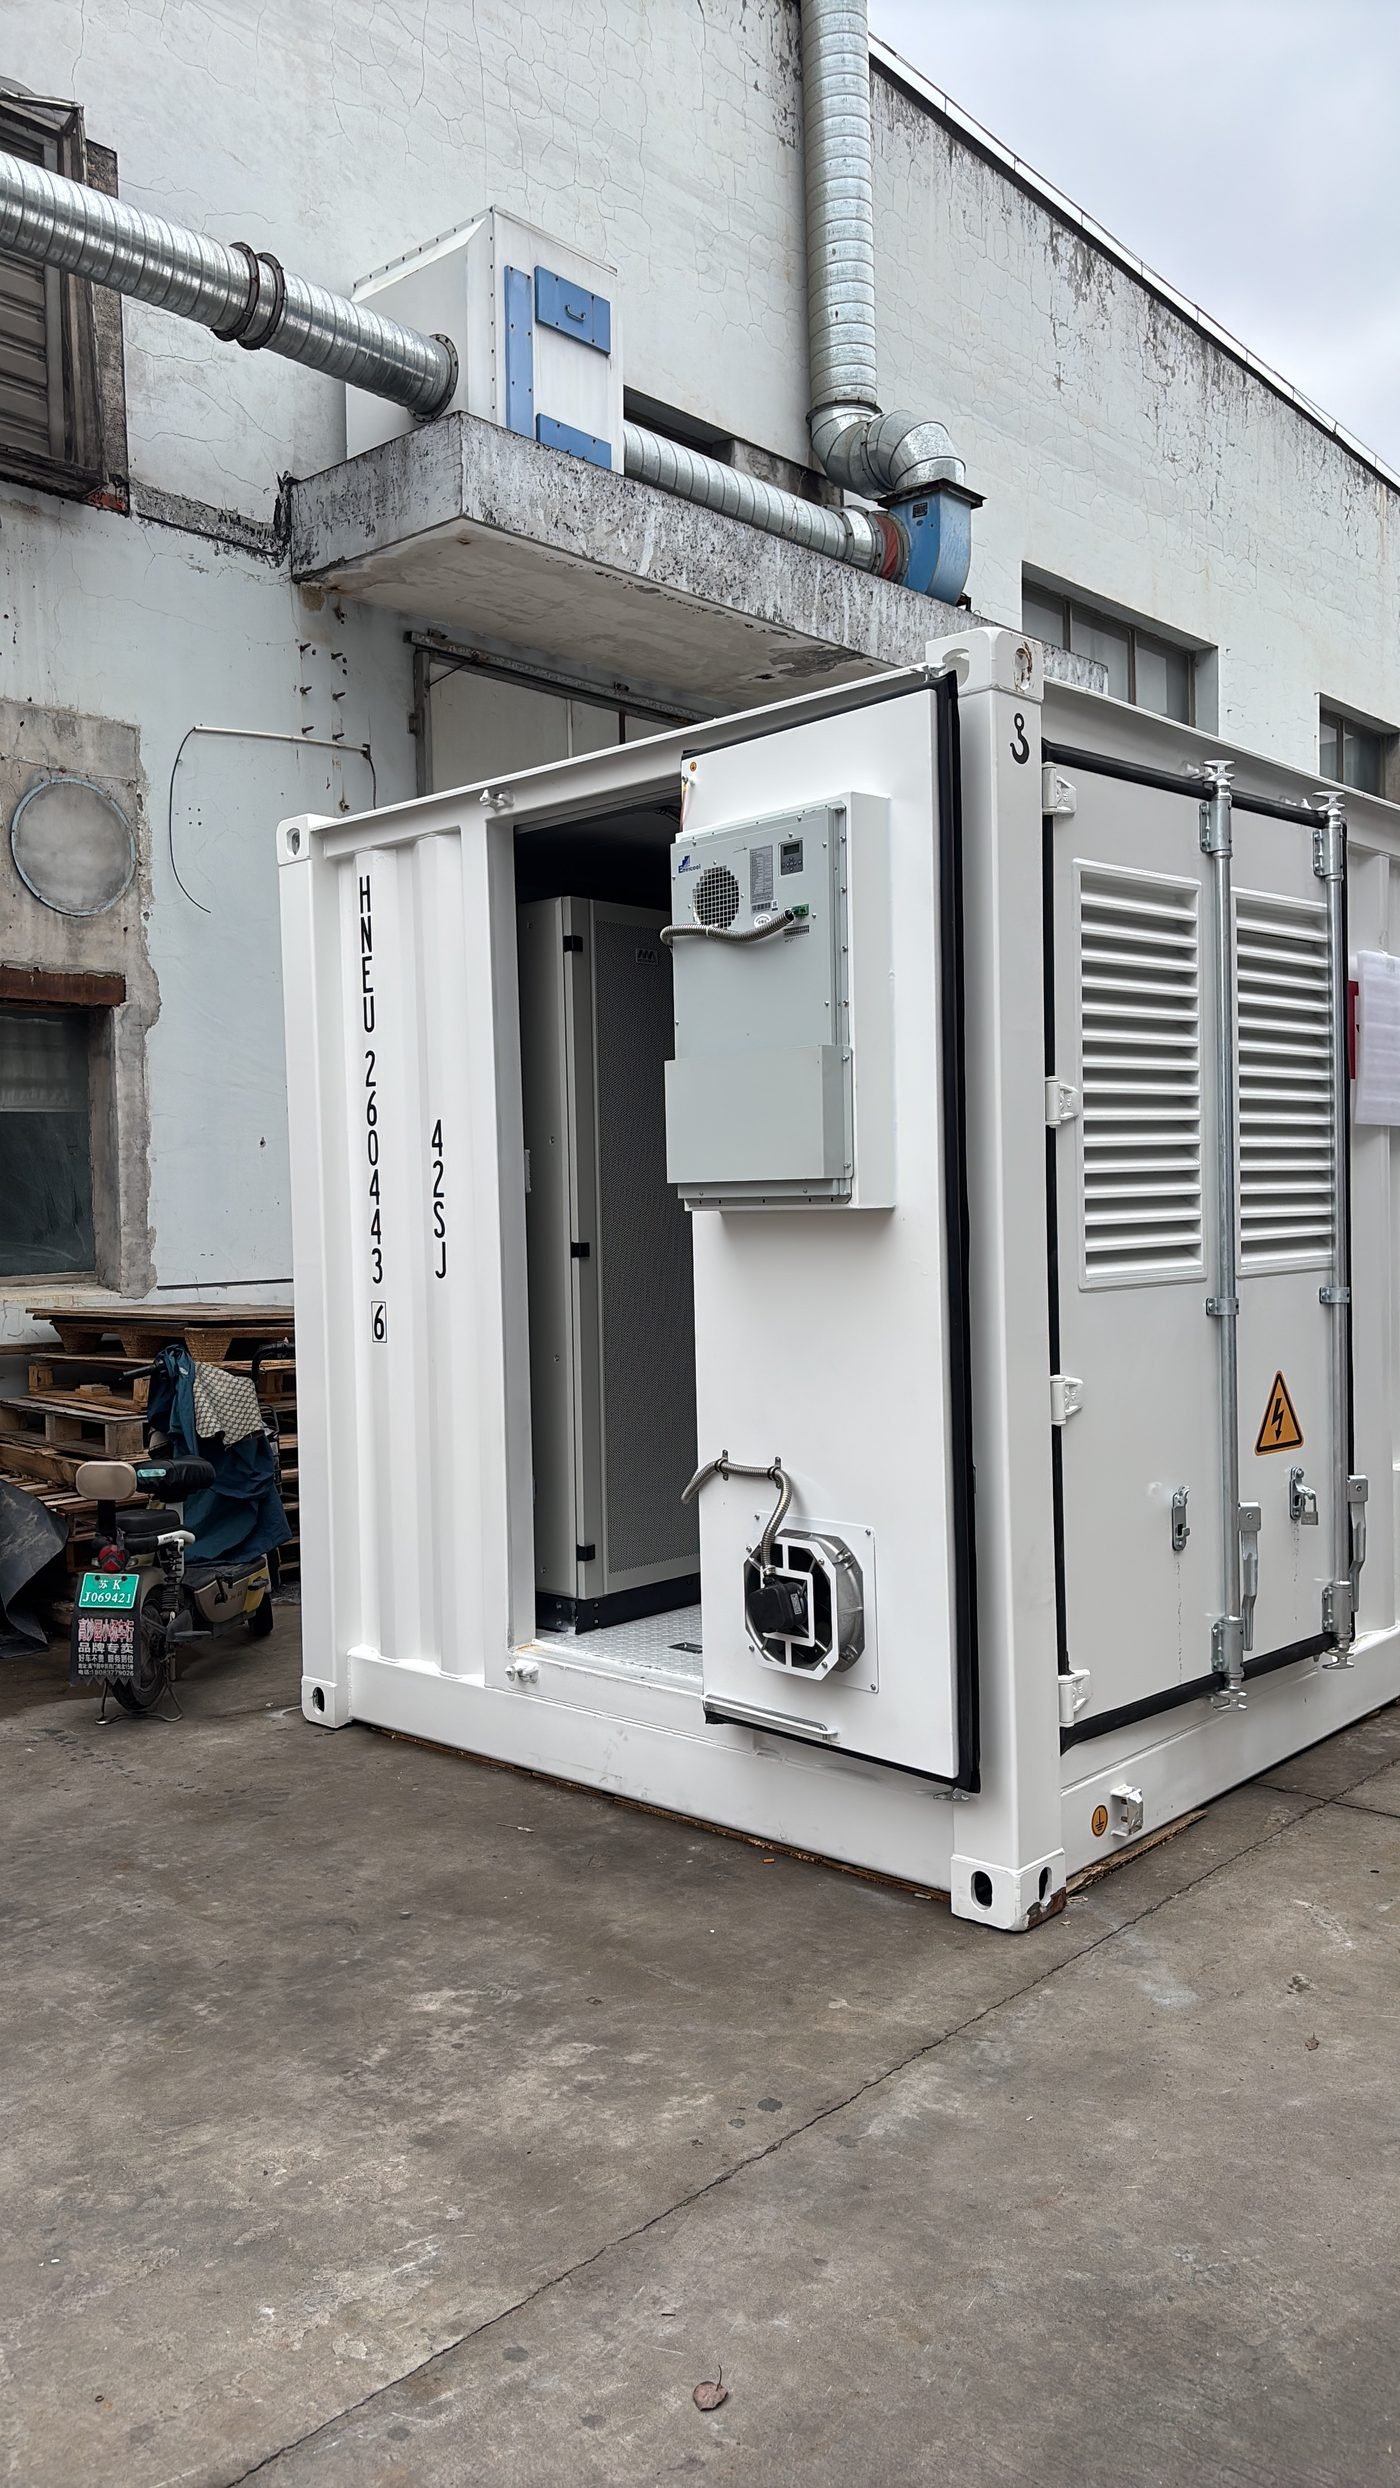
The last step in factory solar sizing is the inverter: kVA = peak simultaneous load × 1.25. The 25 percent is not padding: it is the surge headroom that lets a mill or a compressor start without tripping the plant. Sizing on average load is the most common reason a correctly-sized array still shuts down at 07:50 every morning.
Then check the AC/DC ratio — array kWp against inverter kW. For a Nigerian factory with a strong daytime load, 1.1 to 1.3 is normal; push towards 1.1 if your daytime curve is flat and towards 1.3 if it peaks hard at midday. A ratio above about 1.4 simply clips generation you have already paid for.
Worked Example: a 14-Hour Lagos Factory
This is what factory solar sizing looks like on a real site. Take a plastics plant running two shifts, 14 hours a day, currently on diesel for most of it. Logged data gives 360kWh consumed in solar hours, 170kWh outside them, and a peak simultaneous draw of 75kW.
- Array: 360 ÷ 3.63 = 99kWp → 100kW
- Storage: 170 ÷ 0.80 = 213kWh → 215kWh
- Inverter: 75 × 1.25 = 94kVA → 100kVA
- Reserve: 15–20% held back, already inside the 215kWh block at this load
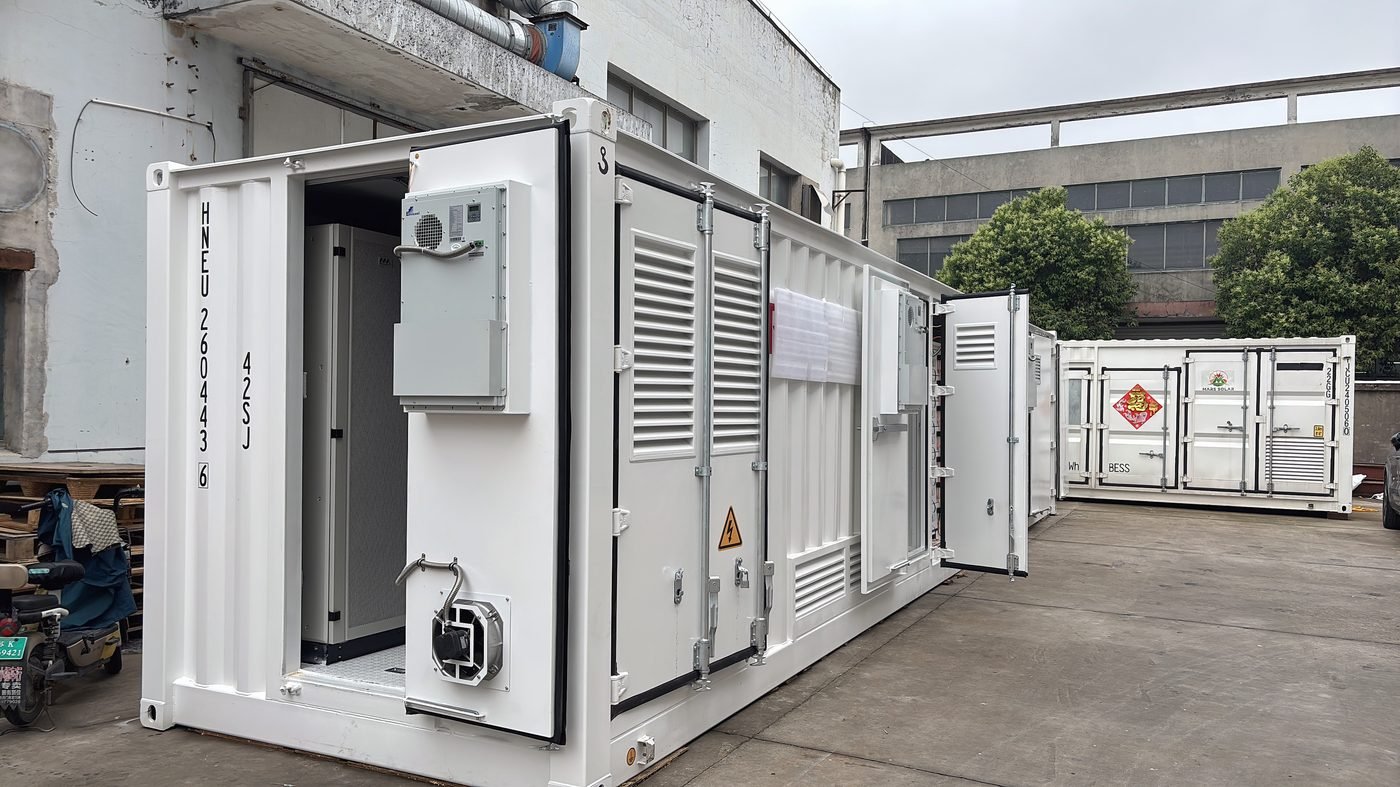
That is precisely our 100kW + 215kWh container reference unit, shipped at CIF $88,000–115,000. The storage block inside it prices at $140–185/kWh CIF Lagos, so the battery accounts for roughly $30,100–39,775 of the total — about a third of the system.
Sanity-check the result against the fuel bill before signing. A plant replacing 14 hours of generator runtime at ₦300–650/kWh recovers the capital in under 18 months, which is the range our Nigerian projects have actually delivered. If your numbers show five years, the load data is wrong, not the equipment.
How Shift Patterns Change Factory Solar Sizing
Two factories with identical monthly consumption can need completely different systems, and the shift pattern is usually why. Factory solar sizing rewards load that coincides with sunlight: a plant running 06:00–18:00 consumes most of its energy inside solar hours, so the array does the heavy lifting and storage only covers the tail of the day and the gaps the grid leaves behind.
A single-shift plant running 10:00–20:00 looks similar on a spreadsheet but is a harder problem: its last three hours fall outside solar hours in every month of the year, so storage has to carry them regardless of season. That is the part factory solar sizing has to solve explicitly rather than assume away. Extend to a night shift and the array stops being the primary source altogether — storage and grid carry the load, and generation only offsets what happens in daylight.
The practical test is the daytime fraction: daytime kWh divided by total daily kWh. Above about 0.6, factory solar sizing is straightforward and payback is short. Between 0.4 and 0.6 it still works, but storage dominates the bill of materials and the economics hinge on the battery price per kWh rather than the module price per watt. Below 0.4 you are buying a battery with some panels attached, and it is better to say so in the request for quotation than to discover it at commissioning.
None of this is an argument against solar — it is an argument for reading the curve before the quote arrives. Both factories in this example will be offered the same 100kW system by any supplier who only asks for the monthly bill.
What Factory Solar Sizing Costs in Nigeria in 2026
Factory solar sizing only means something once it is priced, so convert the two numbers into money before you compare suppliers. The two standard configurations below cover most Nigerian industrial sites; anything in between is usually built from the same blocks.
| Configuration | Typical factory | CIF Lagos / Onne |
|---|---|---|
| 100kW + 215kWh | Two-shift plant, ~75kW peak | $88,000–115,000 |
| 500kW + 1MWh | Multi-shift plant, ~375kW peak | $390,000–480,000 |
| Modules, per watt | — | $0.28–0.48/W |
| Battery block, per kWh | — | $140–185/kWh CIF Lagos |
| Landed cost vs FOB | — | CIF = FOB × 1.20–1.35 |
Duty and clearance sit on top: 5–7 percent duty plus 7.5 percent VAT, a clearing agent at ₦500,000–₦1,500,000 per container, and ₦1.5M–4M for the last mile from port to site. The full landed-cost walk-through is in the BESS cost and import guide for Nigeria.
Five Mistakes That Distort Factory Solar Sizing
Each of these five makes factory solar sizing wrong in a different direction, and each one is cheap to avoid at design stage and expensive to fix after the container lands.
- Sizing to roof area. Roof is a constraint, not a driver.
- Assuming five peak sun hours. Lagos averages 3.63 kWh/kWp/day; the difference is a third of your generation.
- Ignoring motor surge. Peak simultaneous demand, not nameplate, sets the inverter.
- Comparing nominal kWh. Usable capacity at 80 percent DoD is the only figure two quotes can be compared on.
- Designing on the annual average. The wettest month is what starts your generator.
Two of these five are avoided by reading your own curve correctly; the remaining three are avoided by making every supplier quote against the same written factory solar sizing schedule. are avoided by asking every supplier to quote against the same written schedule. That schedule is the subject of the 7-point factory audit.