
Quick answer: TOPCon vs HJT
TOPCon is the default for commercial imports in 2026: it holds the largest share of global cell capacity, ships at the widest power range and costs least per watt. HJT delivers the highest mass-production cell efficiency but at a higher equipment cost and narrower supplier base. BC leads on module efficiency and appearance, and suits projects where roof area is the binding constraint. For most commercial and industrial buyers in emerging markets, TOPCon remains the lowest-risk choice on price and availability — but three things settle the TOPCon vs HJT decision, and efficiency is the least decisive of them.
What TOPCon, HJT and BC mean
A TOPCon vs HJT comparison only means something once the structures are clear, because the three are not variations on one design — they are three different ways of stopping electrons recombining at the cell surface, and each carries a different manufacturing consequence.
TOPCon (tunnel oxide passivated contact) adds an ultra-thin oxide layer and doped polysilicon film to the rear of an n-type cell, cutting recombination at the contact. It is built on upgraded PERC lines, which is why supply is broad and pricing is competitive.
HJT (heterojunction) sandwiches a crystalline silicon wafer between thin amorphous silicon layers. The structure keeps high open-circuit voltage and allows lower processing temperatures, but needs new production lines rather than retrofits.
BC (back contact) moves all metal contacts to the rear of the cell, removing front-side shading. The gain is module efficiency; the trade-off is a more complex process and a longer yield ramp.
Where the three technologies stand in 2026
| Technology | Capacity / share | Typical module power | Reported efficiency | Supply situation |
|---|---|---|---|---|
| TOPCon | More than 800 GW of cell capacity, above 65% of the global total; 58% of module shipments in H1 2026 | 210R-66 format, 660 W mainstream, up to 670–680 W | Mass production cell efficiency above 26% | Widest supplier base; shortest lead times |
| BC | Scaling fast from a small base; LONGi has guided more than 50 GW of 2026 BC shipments | 660–670 W mainstream, up to 680 W | Up to 24.8% module efficiency on LONGi Hi-MO 9; around 25% reported for several BC lines | Concentrated in a few makers; premium pricing |
| HJT | Smallest installed base of the three | Typically 600–700 W class depending on format | Mass production cell efficiency above 26.5% | Limited makers; sensitive to paste and equipment cost |
Sources: SNEC 2026 exhibition reporting (June 2026); China Photovoltaic Industry Association figures cited in industry press (October 2026); efficiency claims are manufacturer-reported. Treat share figures as directional and confirm against the latest CPIA release before contracting. For the global build-out behind these numbers, the two references we use are the IEA solar PV capacity and generation data and the IEA Renewables 2025 report.

Why capacity share matters to a buyer in year eight
Share figures matter to an importer for one reason that has nothing to do with this year's price: capacity depth decides what happens when you need a replacement module in year eight. A technology with the largest installed base is the one most likely to still be in production, and the one whose format is most likely to be mechanically and electrically interchangeable with what is already on your roof. A concentrated supply base means one maker's product roadmap becomes your maintenance risk — a single format change can leave you unable to match a string electrically without replacing the whole array section.
That is the practical reason we treat availability, not the efficiency column, as the first filter in the TOPCon vs HJT decision. Efficiency is the number on the datasheet; interchangeability is the number you discover eight years later, at your own cost.
Efficiency, degradation and heat behaviour
| Factor | TOPCon | BC | HJT |
|---|---|---|---|
| Module efficiency | Commonly 22–23% in volume supply | 24–25% on current products | 23%+ reported, varies by maker |
| Temperature coefficient | Roughly −0.29%/°C | Comparable to TOPCon | Among the better figures reported |
| Bifaciality | Widely available, commonly around 70–80% | Available on some lines | Available |
| First-year degradation | Typically around 1% on mainstream products | Reported around 0.4% on some distributed-roof products | Low, varies by maker |
Efficiency differences matter most when the roof or land area is fixed — and the array has to be sized against your own load profile before the technology question is worth asking. A 25%-efficient module produces the same power as a 22% module using roughly 12% less area, which lowers mounting, cabling and labour. What it does not change is energy yield per rated watt: a watt is a watt at standard test conditions, which is the single most misunderstood point in the TOPCon vs HJT argument.
What the TOPCon vs HJT choice does to the balance of system
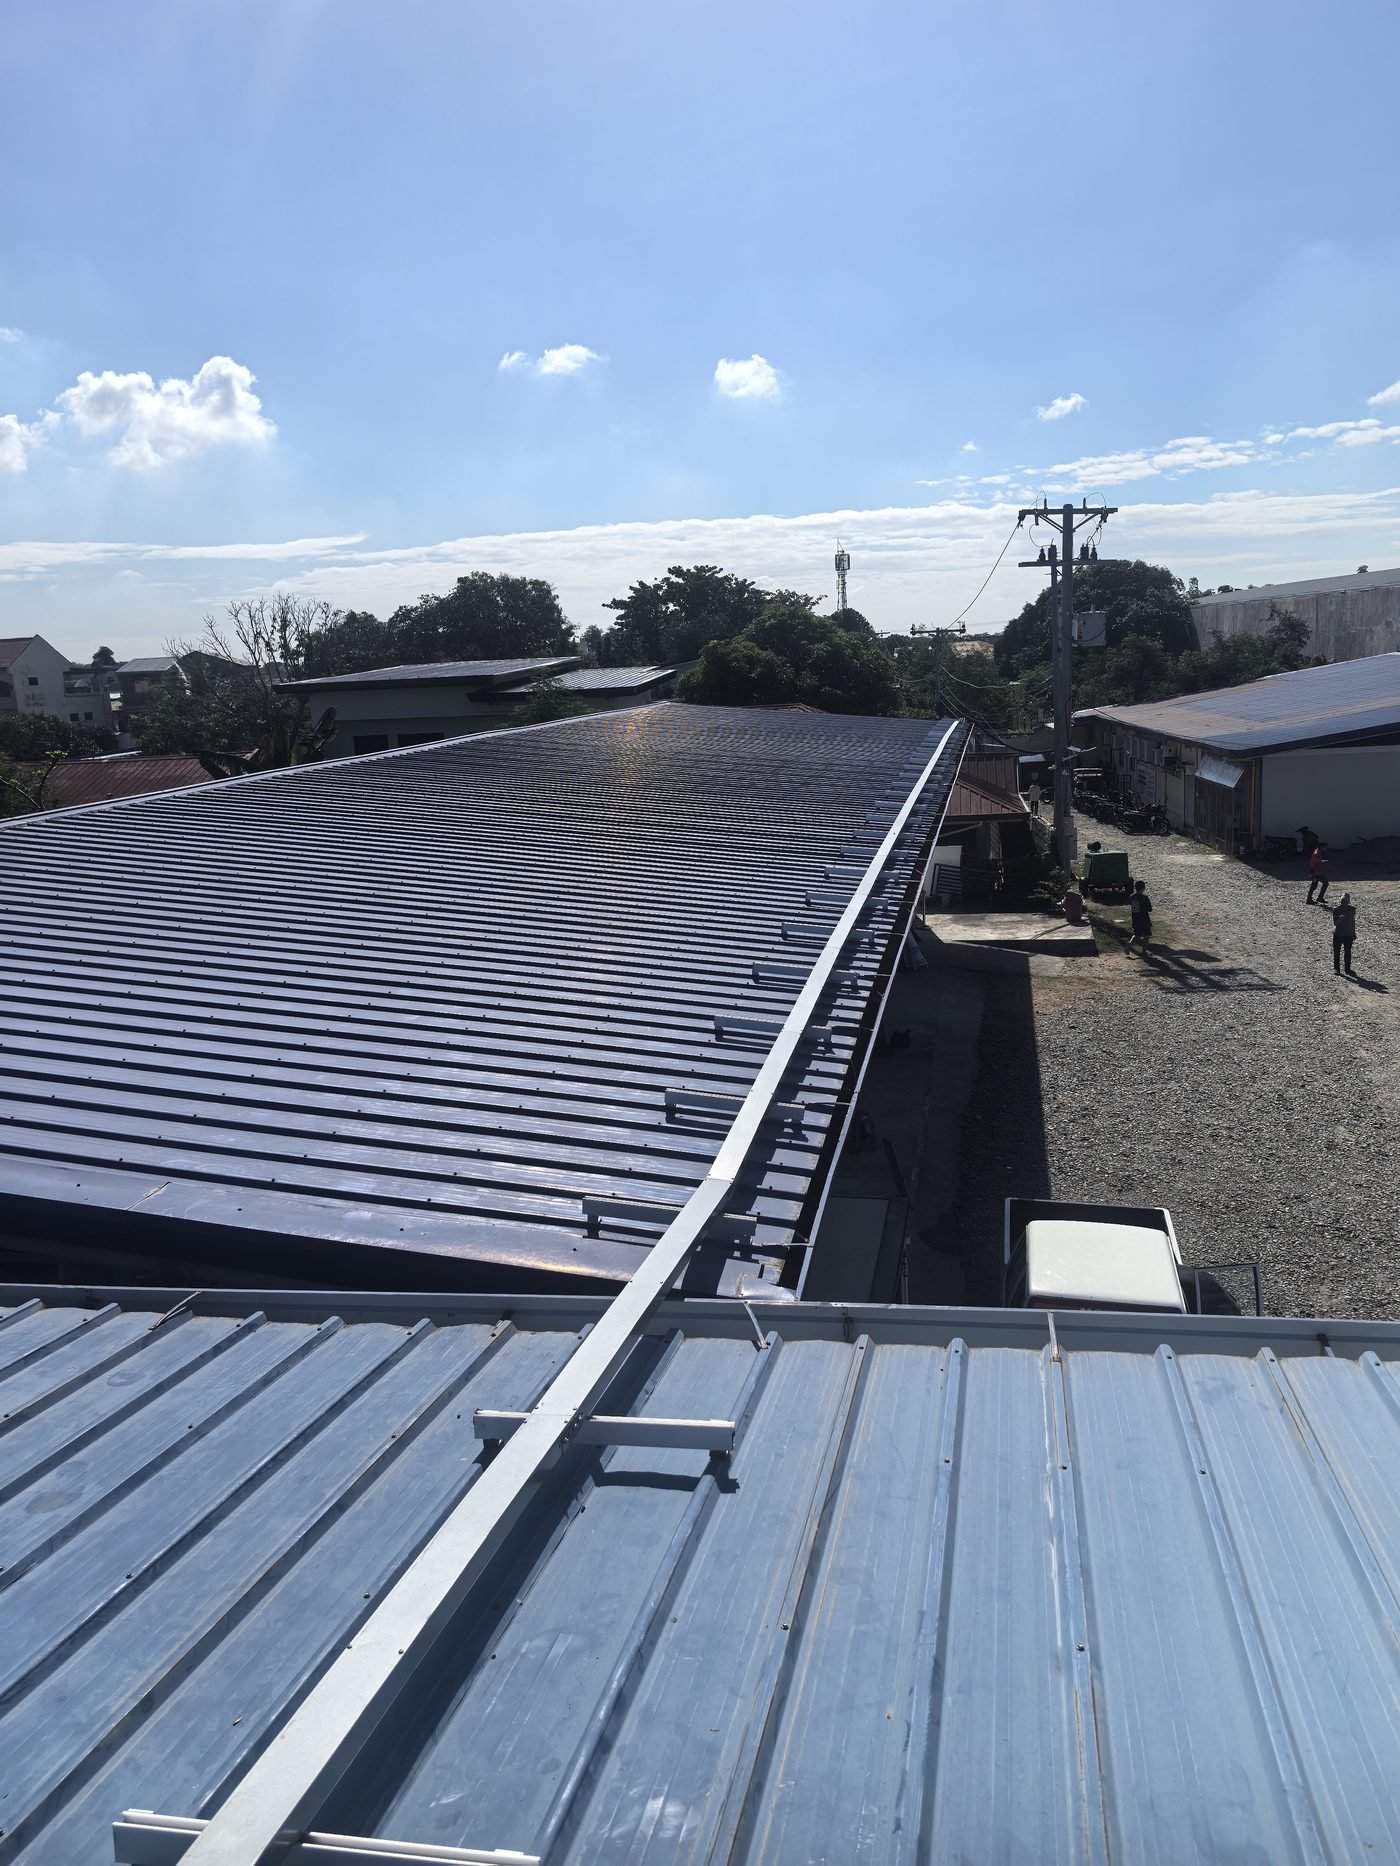
The most common claim made for high-power modules is that they shrink the array. They largely do not. A 650 W module is physically bigger than a 550 W one, so 100 kW occupies roughly the same roof either way — about 470–480 m² of module area in both cases. This is where the TOPCon vs HJT debate is most often mis-sold.
What does change is the module count, and the count is what your balance-of-system bill is built on:
| Basis | At 550 W modules | At 650 W modules | What the difference buys |
|---|---|---|---|
| Modules for a 100 kW array | 182 | 154 | 28 fewer clamp sets, 28 fewer mid-clamps, fewer rail joints |
| Module area | ≈473 m² | ≈477 m² | Nothing — the roof requirement is the same |
| DC string count | Higher | Lower | Fewer home runs, less DC cabling and combiner hardware |
| Handling and installation time | Higher | Lower | The saving is real but modest on 100 kW; it compounds on 1 MW+ |

Read that table before paying a premium for efficiency. On a 100 kW rooftop the balance-of-system saving is modest; on a multi-megawatt ground mount, where racking and labour scale directly with module count, it becomes the reason to go to the higher-power format. If your job is 100 kW on a warehouse roof, the TOPCon vs HJT efficiency spread is very unlikely to be worth money on its own.
What each technology costs per watt
On price, the TOPCon vs HJT gap is narrower than the efficiency gap suggests — read it as a spread, not a fixed premium. On a factory-gate basis, tier-1 n-type modules are currently quoted in a band of about $0.28–0.48 per watt FOB China. Within that band, TOPCon sits at the lower end because its capacity is deepest, BC carries a premium for its efficiency and appearance, and HJT varies most with the supplier's paste and equipment cost.
For a 100 kW array, the arithmetic is direct: 100,000 W × $0.28–0.48/W gives $28,000–48,000 FOB for the modules alone. Module cost is only part of a system price; in a complete 100 kW + 215 kWh containerised system quoted CIF at $88,000–115,000, the modules are a minority of the total once inverters, batteries, mounting, cables, freight and clearing are counted.
Lead time, allocation and where the TOPCon vs HJT decision is actually made
In practice, most TOPCon vs HJT decisions are made on availability, not on the datasheet. Three risks sit behind the technology label, and none of them appear in a spec sheet:
- Allocation. TOPCon capacity is deepest, so it is usually the fastest to allocate. BC and HJT allocations tighten, and they tighten further if you require a specific power bin or a market-specific certification package.
- Cell sourcing. A shipment built from mixed cell batches complicates any later warranty claim, because degradation curves are batch-specific. Ask whether the batch is single-sourced, and get it in writing.
- Substitution clauses. Supply agreements sometimes allow the maker to deliver an equivalent-power module of a different cell type. If your string configuration, your temperature-coefficient assumption or your certification file depends on one technology, that clause matters more than the name on the frame.
That last point is the part of TOPCon vs HJT that no datasheet shows. A supplier who substitutes quietly may hand you a technically compliant array that no longer matches the single-line diagram your inverter supplier signed off — and the cost of discovering that at commissioning is far higher than the efficiency you were optimising for.
How the TOPCon vs HJT choice changes by market
| Market | What the site conditions push towards | Recommended default |
|---|---|---|
| Philippines | Commercial tariff around $0.156/kWh; net-metering export credited at roughly ₱5.50–6.50/kWh under Meralco; typhoon exposure on many sites | TOPCon with wind-rated mounting; BC where roof area is tight on hotels and resorts. Full figures in our Philippines solar system price guide |
| Nigeria | Tariff around $0.049/kWh, so bill savings are weak; the business case runs on diesel displacement. Yield at Lagos averages about 3.63 kWh/kWp/day | TOPCon on cost; prioritise warranty scope and bankability over marginal efficiency |
| Kenya / Ghana | Commercial tariffs around $0.171 and $0.175/kWh | TOPCon; BC for constrained rooftops |
| Central America | Tariffs range from about $0.172/kWh in the Dominican Republic to $0.229–0.255/kWh in Costa Rica; high humidity and coastal salt exposure | TOPCon with IEC 61701 salt-mist certification; HJT where its low temperature coefficient is valued |
| Gulf / Middle East | Very low tariffs (Qatar around $0.036/kWh, Saudi industrial around $0.053/kWh) mean savings are not the driver; projects are built for self-consumption and reliability in extreme heat | Prioritise temperature coefficient and soiling resistance; TOPCon or HJT depending on supplier support. See our solar panels in Middle East heat analysis |
Tariff figures: GlobalPetrolPrices, December 2025. Yield figures: Global Solar Atlas 2.0 / Solargis-World Bank (2026-04). Local conditions override any default — size against your own load profile first.
What to specify in the purchase contract
Whatever you decide on TOPCon vs HJT, the contract carries more risk than the cell choice. Ask for these five items in writing:
- Product warranty and power warranty, separately. A 12-year product warranty and a 25-year linear power output warranty are the current baseline on Mars Solar systems. Confirm whether the power warranty is linear or stepped.
- Degradation curve in numbers. First-year figure, then the annual rate, then the end-of-term percentage.
- The exact bill of cells and format. Wafer size, cell count, and whether the batch is single-sourced, since mixed batches complicate warranty claims.
- Flash-test data and bin tolerance. Positive-only tolerance and the power bin you are being sold.
- Certificates matched to your market. IEC 61215 and 61730 as standard, IEC 61701 for coastal sites, plus whatever your grid operator requires for interconnection.
FAQ: TOPCon vs HJT vs BC
In the TOPCon vs HJT comparison, is TOPCon still the right choice in 2026?
How much more does a BC module cost?
In TOPCon vs HJT terms, does HJT pay back its higher cost?
Between TOPCon vs HJT vs BC, which technology degrades least?
Does a higher-efficiency panel generate more electricity per rated watt?
Should I choose bifacial panels for a rooftop?
What panel technology suits a hotel or resort?
Do these technologies change the inverter choice?
In TOPCon vs HJT procurement, what are the lead times?
Where can I see the full system prices behind these panels?
Need a TOPCon vs HJT configuration for your site?
Every commercial system we ship is engineered against your real load profile before it is quoted, and we quote the technology that fits your market rather than the one with the best headline efficiency. Send your last 12 months of electricity bills and a roof or site plan, and we will return a TOPCon vs HJT recommendation, a configuration, a landed cost and a payback calculation.